I would like to share my tips on how to build your first pail of gold (第一桶金).
First of all, the most important is have a strong will. If you want to success, then build your mind that you really want to success. If you want to get rich, then write it down, print it out on paper with font size 72 "I want to get rich!!". Read to yourself 3 times a day. Hypnotize yourself, do whatever you can to build this strong mind. This determination will drive you throughout every hurdles. With this, you know what you really want; with this, you will ignore all the distraction; with this, you will push yourself break through your limitation and lead to the correct path. Simple step? NO! 99% of people can't. Why? Human nature-> Laziness. That's why not many people success.
Below are just 3 simple yet powerful tips:
(1) Manage your expenses and desire
If your income increase 4% yearly while your expense also increase 4%, then you will not get richer. You don't need to spend more just because you have more money. The $1 you save and invest may earn another $1. But the $1 you spend will be gone forever. Of cos I don't mean don't spend at all. Just manage your expenses. A $3 chicken rice will make you full while $130 lobster may only make you half full. You may eat lobster once a year, if you can afford, but you don't need to have great feast every month.
Human desire is unlimited. Today you may want to drive a Toyota, tomorrow you may think of BMW. But actually you may just need a car. If you need a bag, you may buy yourself a Coach but not necessary a LV. A LV is longer a LV if everybody, include Pasar Aunty also carry a LV. Always ask yourself, "is this a need or want?" You will find out, there are not many things that you "need" to keep you survive and most of the "want" can wait.
(2) Invest in yourself.
Build your earning power. I always believe work hard to earn your salary is the most basic, yet safest and highest return investment. Read more on "Best Investment tip"
(3) Learn various investment tools.
When you have some "bullets", then you can invest in various investment tools. Even you want to buy TOTO, you need to have money to buy TOTO, right? (by the way, buy TOTO is not investment.) Read more investment books, (Read more on "Investment books"), know the CORRECT investment habits and methods. Let your money earn more money.
Wednesday, July 31, 2013
My Excel Investment Portfolio Scrap Book
This is the enhanced version of stock calculators in the previous post.
New Features:
(1) Allow stimulation/record for multiple purchases or dollar averaging. As shown below, you can input multiple purchases and the average purchase price is auto calculated.

(2) A summary page of total portfolio; included a reminder to cut-loss if the loss of individual stock exceed 7%.

New Features:
(1) Allow stimulation/record for multiple purchases or dollar averaging. As shown below, you can input multiple purchases and the average purchase price is auto calculated.
(2) A summary page of total portfolio; included a reminder to cut-loss if the loss of individual stock exceed 7%.
You can download the excel here:
https://www.dropbox.com/s/7xvtuenyzlb1l39/StockCalculator_v4.xlsxMonday, July 29, 2013
Buy minimum 1000 lots?
One of my good friends learn to buy share by buying the minimum of 1000 lots. This trigger my thinking that, "Is it ok to buy the minimum of 1000 lots?".
Most trading agency charge minimum $25 per transaction. If you buy 1000 lots, the break-even minimum charge of $25 => $25/0.28% = $8,926. In other words, if you buy a share of price $8.926, they will charge you $25, same as the minimum charge.
Then what's the impact of charges over the total cost/invested amount? As shown below, if you buy 1000 lots of a share with price $0.5, you will be charge of $25.24, which is equal to 25.24/(500+ 25.24) = 4.8%. So, if you invest just $525.24, you loss 4.8% immediately. Similar with price $1 share. You invest $1,025.48, you loss 2.5% due to charges.

Conclusion: when the share price is small, try to buy more lots. Try to make sure every transaction cost at least $2,000 (e.g. 2,000 lots of share with price $1 or 1000 lots of share with price $2).
Most trading agency charge minimum $25 per transaction. If you buy 1000 lots, the break-even minimum charge of $25 => $25/0.28% = $8,926. In other words, if you buy a share of price $8.926, they will charge you $25, same as the minimum charge.
Then what's the impact of charges over the total cost/invested amount? As shown below, if you buy 1000 lots of a share with price $0.5, you will be charge of $25.24, which is equal to 25.24/(500+ 25.24) = 4.8%. So, if you invest just $525.24, you loss 4.8% immediately. Similar with price $1 share. You invest $1,025.48, you loss 2.5% due to charges.
Conclusion: when the share price is small, try to buy more lots. Try to make sure every transaction cost at least $2,000 (e.g. 2,000 lots of share with price $1 or 1000 lots of share with price $2).
Thursday, July 25, 2013
Tips for recording your expenses
Have you read any personal financial planning (理财) book before? Most books have a common topic about recording your expense. I followed that also. But it doesn't work! No matter I install an App or write in on a notebook or keep my receipts and record it later. This is because human nature ---Lazy.
Another possible reason is: some may think that, it doesn't worth the effort to record $1 expense. It is very troublesome record every single expense.
Eventually, for whatever reasons, high chance that this method will fail.
Few years back, I found out a solution: just record whatever balance in your bank is enough. This will be the closing balance for the month and also the opening balance of the following month. Taking "closing" - "opening"(which equal to movement) will be your expenses for the month. As shown below:

Beside this, if you can work harder to record "Big expense/income for the month (e.g. buy LV bag, strike 4D )" plus "fix expenses(e.g. Children school fee, Join-Account contribution); you can more and less gauge and manage your $ already.
If you have investment, just add that to the movement.
If you like to keep cash in biscuit can or your case-dough(私房钱), you can add lines beneath Opening and Closing. Just make sure this file is inaccessibility from your wife. :0
You may use the following Excel and customize to your need. Give it a try. It works for me. I have been recording for 4 years already.
https://www.dropbox.com/s/ktyuhe43af3aqr6/PersonalExpense.xlsx
Another possible reason is: some may think that, it doesn't worth the effort to record $1 expense. It is very troublesome record every single expense.
Eventually, for whatever reasons, high chance that this method will fail.
Few years back, I found out a solution: just record whatever balance in your bank is enough. This will be the closing balance for the month and also the opening balance of the following month. Taking "closing" - "opening"(which equal to movement) will be your expenses for the month. As shown below:
Beside this, if you can work harder to record "Big expense/income for the month (e.g. buy LV bag, strike 4D )" plus "fix expenses(e.g. Children school fee, Join-Account contribution); you can more and less gauge and manage your $ already.
If you have investment, just add that to the movement.
If you like to keep cash in biscuit can or your case-dough(私房钱), you can add lines beneath Opening and Closing. Just make sure this file is inaccessibility from your wife. :0
You may use the following Excel and customize to your need. Give it a try. It works for me. I have been recording for 4 years already.
https://www.dropbox.com/s/ktyuhe43af3aqr6/PersonalExpense.xlsx
Excel Tips 1
Excel Tips:
(1) To determine the quarter of a particular date, use
formula:
=ROUNDUP(MONTH(A1)/3,0)
(2) To determine the last day of a month, use formula:
=DATE(YEAR(A1),MONTH(A1)+1,0)
(3) To determine no. of days between 2 dates, use hidden
Excel formula:
=DATEDIF(startdate, enddate,""d"")
(4) Instead of using formula: =IF(OR(A1=1,A1=3,A1=5), TRUE,
FALSE)
, use formula =IF(OR(A1={1,3,5}), TRUE, FALSE)
Replace wording in RED with your
specific cell.
Stock call 26 Jul 2013
You may aware that many stocks are recovering from previous MAY'2013 adjustment. If you want to follow the strategies in my previous post(Investment Strategies, part 2), there are some potential good stocks that fulfill the conditions.
M1 is a bit late to catch, but breadtalk, starhub etc still not far away from the buying point.
Disclaimer (again?!) : I am not buying any of these as I finished my bullet. This is just a suggestion. Please exercise your judgement. You don't share with me your profit, so, it's unfair for me to share with your losses, right? :)
Singtel M1 Starhub
People always like to compare Singtel, Starhub and M1. They are the only 3 big players in Telecommunication market of Singapore. So, let's see how they perform using the method in the previous post.

Market Cap : 1 Singtel = 8 Starhub = 20 M1
Profitability : Singtel> M1 > Starhub
Earning Per Share (EPS) : Singtel > Starhub > M1
The "Cash flows from operating activities / Net income" of all 3 companies are more than 1; meaning they can make more money than Net Income. Good.
It's no fair to compare ROE% as the capital structure of these 3 companies are different. Starhub is extremely heavy on debts (40.6), Singtel(0.7) on equity while M1 is slightly more on debts (1.8)
So, which one more worth to invest? Well, financially there are not much different as these 3 are performing quite well, except the down trend of Margin% of M1. So, you may look for other areas, especially the qualitative side. For stability concern, Singtel is still the best as they don't have too much debts. If you aim for dividend yield, then you can look for dividend payout and time the market to get the yield you want(3.5% to 4.6% as at the price now).
For me, I won't go for any of these yet because limited capital I have now. The cheapest, M1, also cost $3,300 per lot now. But I would definitely buy some to diverse my portfolio risk. Telecommunication market is always presumed to be a stable industry.
https://www.dropbox.com/s/e5pd0nbinrq4krt/Singtel_M1_Starhub.xlsx
Tuesday, July 23, 2013
Filtering Midcap and Smallcap shares
Follow by previous post, I am going to share how to do first level filtering to shorten your list. I am going to use the http://www.shareinvestor.com/sg platform. I think you need to register to use the following function.
Step 1: choose "Edit Custom" under the "column layout".

Step 2: build the column as shown below or whatever you like. But keep the "ROE(%)" and "Net Earnings Margin(%)". We need these later.

Step 3: Choose "Custom" under the "column layout".
Step 4: Copy everything into Excel
Step 5: Sort "Net Earning Margin(%)". Largest to Smallest.
Step 6: Remove those "Net Earning Margin(%)" below 10%.
Step 7: Sort "ROE(%)". Largest to Smallest.
Step 8: Remove those "ROE(%)" below 15%.
Congratulation! You have just reduced the Midcap list from 50 to 12. You can repeat the same things for Smallcap which should reduce the list to 28. Please note that those list you "removed" may not be bad companies. ROE 15% is very close to ROE 14%. MapletreeGCC may not be a bad company, just because it doesn't has many data for analysis.
Side track a bit, do you happen to see "NOL" in Midcap? Last time this company was STI component share. But it lost money and trading at it's NAV now. So, STI component shares, or so call "blue chips" may not always be stable forever shares.
It's quite fun to learn what companies are doing and how they perform. Not only you can have more topics to talk with you friends, business talk with bosses; You can know what company to look for for your next job. Normally good companies pay good bonus...:)
I have filtered a list for you if you don't want to repeat the steps above:
https://www.dropbox.com/s/hxlraa46css0sg5/MidCap_SmallCap.xlsx
SQL-EX.RU
Do you think your SQL skill is superb?
Try to do "exercise" at this Russia Website: http://www.sql-ex.ru/
I can guarantee your SQL skill will increase at least 1 level after you complete half.
My current rating 575....about 1 year never log in...:(

Try to do "exercise" at this Russia Website: http://www.sql-ex.ru/
I can guarantee your SQL skill will increase at least 1 level after you complete half.
My current rating 575....about 1 year never log in...:(
CPF Calculator
Many Singapore or PR don't really care about the CPF they have because they can't withdraw the money before retired. But do you calculate the impact of compound interest of Ordinary Account (OA) 2.5%, Special Account(SA) and Medical Account(MA) of 4%?
Senario 1: One graduate born in 1991, start work on age 22 with salary S$2,500. If he retire at age 62, he can get at least $1,065,293 at age 66.

Senario 2: One born in 1985, salary $3k, with current CPF: OA:$10k, SA:$11k, MA:$9k. If he retire at age 62, he can get at least $1,081,571 at age 66.

Why I said "at least"? First, the salary will be increase from time to time. Second, this exclude the additional 1% for the $60k total in 3 accounts.
So, don't under estimate the power of compound interest and do appreciate what Singapore government is doing for her people. Number proof everything.
You may use the calculator to check your contribution at:
http://www.cpf.gov.sg/cpf_info/Online/Contri.asp?prof=emp
I have developed an Excel to forecast your CPF when you retired:
https://www.dropbox.com/s/yxadzm96k8lhs7v/CPF_Calculator.xls
Senario 1: One graduate born in 1991, start work on age 22 with salary S$2,500. If he retire at age 62, he can get at least $1,065,293 at age 66.
Senario 2: One born in 1985, salary $3k, with current CPF: OA:$10k, SA:$11k, MA:$9k. If he retire at age 62, he can get at least $1,081,571 at age 66.
Why I said "at least"? First, the salary will be increase from time to time. Second, this exclude the additional 1% for the $60k total in 3 accounts.
So, don't under estimate the power of compound interest and do appreciate what Singapore government is doing for her people. Number proof everything.
You may use the calculator to check your contribution at:
http://www.cpf.gov.sg/cpf_info/Online/Contri.asp?prof=emp
I have developed an Excel to forecast your CPF when you retired:
https://www.dropbox.com/s/yxadzm96k8lhs7v/CPF_Calculator.xls
Monday, July 22, 2013
FTSE ST Mid Cap and FTSE Small Cap
I suggest to choose stocks from FTSE ST Mid Cap Index or FTSE ST Small Cap Index components for beginners. Not FTSE STI index.
Q1: What is FTSE STI?
A1: FTSE, Singapore Press Holdings (SPH) and Singapore Exchange (SGX) jointly calculate the Singapore stock market's main benchmark, the Straits Times Index (STI), and to create a comprehensive series of stock indices for the Singapore market.
Q2: What is FTSE ST Mid Cap Index?
A2: The next 50 companies by full market capitalization of the SGX Mainboard universe, that are not large enough to be constituents of the STI, and that pass the relevant investability screens.
Q3: What is FTSE ST Small Cap Index?
A3: Companies within the top 98% by full market capitalization of the SGX Mainboard, that are not large enough to be constituents of the STI and FTSE ST Mid Cap Index, and that pass the relevant investability screens.
Q4: Why not STI index shares?
A4: Invest in STI index shares mostly need huge capital investment and they are big companies and no much room for growth. Nevertheless, this may be a good place to diverse your portfolio when your capital grow to, let say S$100k.
Q5: Why mid cap or small cap?
A5: Mid cap and small cap are relatively established and still have room to grow. They are more actively traded so that you can buy or sell freely. Mid cap's market capital (share price x no. of shares) is between $730m to $6,000m with share price of $0.106 to $7.18. Small cap's market capital is between $70million to $1,200million with share price of $0.026 to $2.07.
Personally I prefer mid cap than small cap because mid cap has more companies that I am more familiar like M1, SingPost, FCT etc. Don't anyhow buy any Kucing Kurap just because they are cheap. Yes, the share price can double from $0.010 to $0.020 but it is relatively less stable.
I am using sharesinv.com and shareinvestor.com as my analysis platform. You can register for free to join but only limited information is available. You can pay subscription for more functions and information. Sharesinv is S$7 per month or $70 per year. Shareinvestor is S$126 per year. You can access the component of FTSE ST Small Cap or FTSE ST Mid Cap as shown below.
Ok, you have your 154 shopping list. 50 from Mid Cap and 104 from Small Cap. No, don't start clicking company 1 by 1. I will share how to filter non-profitable companies in next post.
Investment Strategies, part 3
This is my version of technique to select a "good" company. Some may call this "value investing" or the intrinsic value behind the company. There are 4 areas: profitability, safety, valuation and growth.
Profitable :
(1) ROE >15%
(2) Net profit >10%.
Safety :
(1) Cash flows from operating activities / Net income > 50%
(2) Free cashflow >0
(3) Debt-to-equity ratio < 0.5
Valuation: ???
Growth: Compound revenue growth rate(CAGR)>10%.
(Note: This book use "Business", "Management", "Numbers" and "Valuation" Personally, I strongly agree that qualitative analysis of a company is important, but this should come after quantitative analysis, i.e. after use number to filter out non-performing companies.)
Some explanation:
(1) ROE: Return on equity=Net Income/Shareholder's Equity. Company's money come from 2 sources: Loan from bank etc(call debt) or share holders' money (call equity). So, this measure how much you can get from the company you invested. 15% means if you invest $100, $15 is the profit company generated by using your $100.
(2) Net profit %: How much profit company generated at the end of each period. 10% means if the revenue is $100, company can get $10 at the end.
(3) Cash flows from operating activities / Net income : these two figures can get from Cash Flow Statement. This measures how much cash the company can collect compare with money earned. Company can earn $100 but it may not collect $100 cash. The cash it can receive back is also important. Analyse 5 years trend.
(4) Free Cashflow : "Cash flows from operating activities" minus "Cash flows used in investing activities". This is to check whether company like to burn money. If this is negative, that means company invests more on what it earns for that period. We should analyse about 8 years trend (about 1 economy cycle).
(5) Debt-to-equity ratio: Company will not bankrupt if it owe share holders' money but definitely in deep shit if cannot pay bank money(debts). So, this ratio is measuring how heavy a company relies on debts. Higher means riskier.
(6) Compound revenue growth %: an average growth rate over a period of several years. You can use Revenue, Net profit, EPS or operational cash flow. Formula = (FV / PV) ^ 1/n -1. FV : current year value. PV : Previous year value. n: no of years between FV and PV.
A good company must be profitable in its core business. Why core business? Sometime company may earn a lot when strike Toto but it may not strike Toto every year. So, we need to understand where the profit come from. Other one-off profit may be: gain from selling land/building/assets, tax gain, one-off investment gain etc. There are much more "window dressing" method that can make the annual report look nicer, it needs skill to detect it.
Did you notice I skipped the valuation part? Many book will teach you valuation technique like Dividend discount model(DDM), Net Asset valuation, Margin of safety etc. Personally, I think buying price or selling price should based on technical analysis and understanding the economy. Simply because all these calculation won't warn you if economy crisis is coming.
The indications above are just some basic measurements. The more you understand the company, the well-verse and more confident you will be. One last important point, when analyzing a company, we should analyse a few years and see the trend. A stable company should have stable performance over time.
I will share step by step method on how to choose a "good" company in next post.
You may read more on this book :財報狗教你挖好股穩賺20%
(website: http://statementdog.com/)
or book: Value Investing In Growth Companies: How To Unearth High Growth Businesses & Generate 40% To 400% Investment Returns
Friday, July 19, 2013
Investment Strategies, part 2
Second strategy is : 20 Weeks Moving Average (週均線) from林恩如
The rules are simple:
(1) When stock price stand above 20 Weeks Moving Average (100 days MA) AND 20 days Moving Average (20MA) in UP trend => BUY

(2) When stock price drop below 20 Weeks Moving Average (100 days MA) AND 20 days Moving Average (20MA) in Down trend => SELL

The strengths of this strategy is: you can catch the big trend and there is not many in-out. But (1) you need a lot of patient because it may take 2-3 months or more for buy signal. (2) not suitable for big fluctuation stock (3) not always success but if you really can catch the trend, you can earn big money easily.
You can read more from
if you understand Chinese.
Thursday, July 18, 2013
Do not hold stock during financial result announcement period
One important and painful experience I learned from stock market is "Never hold stock during financial result announcement period". If the financial result disappointed or even just miss the target, investors may act pessimistically and drive the share price crazy. Never assume the company is "stable" and may never fall.


You may not even have the chance to "cut-loss"...cry also no tear...
Life is a marathon, not a sprint
Do you want to get rich over the night? What you want after you get $1 million? Will you ask for $2 million? $10 million? $1 Billion? Money can never be enough. Same as desire.
Life is a marathon, not a sprint. The purpose is not reaching the final but enjoy the every moment you run. There is not share that will fly to outer space after you buy the share. The company also take time to make use of your investment to grow.
So, do your homework before invest. Plan the buying price and exit point. Once purchased, sit back and relax, wait for the fruit to ripe. Spend your time on your love, your work, your family, your dream and yourself. Once awhile, maybe weekly or monthly, then take a peep on your investment. Remember, if your investment make you worry, uneasy, stress etc, then you better keep your money in bank or biscuit container..:)
Wednesday, July 17, 2013
Dividend Share Analysis
Follow by Strategy 1, I compiled an Excel to analyse the historical dividend and the average, calculate the "reasonable price (5% yield)", "cheap price (6% yield)" and my magic number of 5.5% yield.
Why 5.5%? The original theory came from Taiwan and maybe not suitable for Singapore STI. Some good companies like CapitalMall, FCT, AREIT may never reach 6% buying price unless market collapse.
Don't put all your money when 5.5% yield. You can divide your money into 3 portion: buy 1 portion when 5.5% yield. If price drop another 5%, buy another portion (price drop 5% further, dividend yield should increase about 0.3%). Lastly if price drop another 5%.
What if the price doesn't drop after you buy? Just wait for another opportunity. If you really hate money in your pocket, I don't mind you donate to me...:)
You may notice I have included "NAV" (Net Asset Value) here. NAV is so called "karung guni"/"Lelong" price. This is the money that share holders can get if the company "bankrupt". So, you can assume this is the cheapest price a company worth. I think for "REIT", share price 10%-20% higher than NAV is reasonable, <10 data-blogger-escaped-cheap="" data-blogger-escaped-is="">20% is expensive. I don't know what happen to "First REIT" and "PLife", they are 50% more than NAV.
NAV concept doesn't apply for Singpost, Singtel, ComfortDelGro etc as they are not asset rich companies.
You can download the excel from:
Tuesday, July 16, 2013
Number is meaningless unless compare with something
100 is many or less? 10% return is good or bad? Answer is: it depends. If you get $100 increment while your colleague gets $200, then it’s not good. But you will be very happy if you get $100 while your colleague gets $50. So, number by itself is meaningless until compare with something. We also need to compare using same category, as we always say “apple to apple” (No! Not comparing Apple Ipad vs Apple iMac).
It is important to familiar with the “norm” number or number sense. For example, Inflation average is 3%, Malaysia Fixed Deposit is around 2.5% to 4%. Singapore Fixed Deposit is less than 1%. So, you won’t be cheated if 1 day OCBC sell you a fixed deposit with 5% return. You will know the number is too good to be true and there must be something behind that.
You can read more from “How to Avoid Getting Lost in theNumbers (Harvard Business School HBS Note)”. Highly recommended! (Come on, just 5 pages....read it! it will benefit you forever!!)
Excel Macro VBA convert date
Sub ConvertDate()
'Purpose: Change a numeric data to a date format which recognizable by Excel
'It detects the no. of digits for a cell.
'10 digits: 31/12/2010 -> 31-Dec-2010
' 8 digits: 20101231 -> 31-Dec-2010
' 6 digits: 311210 -> 31-Dec-2010
' 5 digits: 61210 -> 06-Dec-2010
Dim i As Double
Dim NoOfRows As Double
Dim ColumnNo As Integer
Dim DataRange As Variant
Dim myString As String
Dim MyDateSetting As String
Dim MyMessage As String
Select Case Application.International(xlDateOrder)
Case 0
MyDateSetting = "MDY"
Case 1
MyDateSetting = "DMY"
Case 2
MyDateSetting = "YMD"
End Select
If MyDateSetting <> "DMY" Then
MyMessage = "Windows date setting: " & MyDateSetting & Chr(13) & " Date Separator: " & Application.International(xlDateSeparator) & Chr(13)
MyMessage = MyMessage & Chr(13) & "You may change setting to DMY before running this script: Control Panel-> Regional and language setting->customize->Date"
MsgBox MyMessage
Exit Sub
End If
For Each myRange In Selection
myString = myRange.Value
If Len(myString) = 8 Then
newDate = DateSerial(Left(myString, 4), Mid(myString, 5, 2), Right(myString, 2))
Else
If Len(myString) = 6 Then
newDate = DateSerial(Right(myString, 2), Mid(myString, 3, 2), Left(myString, 2))
Else
If Len(myString) = 5 Then
newDate = DateSerial(Right(myString, 2), Mid(myString, 2, 2), Left(myString, 1))
Else
If Len(myString) = 10 Then
newDate = DateSerial(Right(myString, 4), Mid(myString, 4, 2), Left(myString, 2))
End If
End If
End If
End If
If (Trim(Len(myString)) <> 0) And (TypeName(myRange.Value) <> "Date") Then
myRange.Value = newDate
myRange.NumberFormat = "[$-409]dd-mmm-yy;@"
End If
Next
End Sub
How to find good dividend shares
(2) Set up as below:

- Market Cap at least 100M to filter out small companies
- Dividend yield % must at least 4%
- ROE% is used to filter non-performing companies.
- Last Price to filter too expensive stock (Keppel 1 lot is $10,890)
- Net Profit Margin% to filter low profitability companies.
(3) 23 companies for you to filter further.

Investment Strategies, part 1
I will post a few stock investment strategies start from today. First of all, I want to enforce again, there’s no such thing as sure win strategy. If you win more than you lose, then you are a winner. Secondly, don’t just “plan”, “think”, “wish”. Put your idea into action, the stock market will teach you faster when you learn from your mistake. Different strategy may suit different people. You really need to try and see which strategy suit you more. Thirdly, it is really important to learn “good investment habit”, e.g. cut-loss, or follow your plan. Don’t cheat yourself. When it hit your exit point, then follow your plan to exit. Don’t cheat yourself that “my plan is for long term”. Lastly, Good luck. Remember, investment is just a tool to increase your wealth. Your core should still be work hard in your job.
First strategy is雪球股(snow ball stock), by 溫國信. (you can google “溫國信” to find his book)
Summary:
Find a stock that can give you 6.25% dividend yield. Re-invest the dividend received. So, based on the chart below, you will get 20% return (total) in 3 years. The longer you hold, the higher the return. The key is, re-invest the dividend. The “time of holding” is a “slope”, your capital is the “snow ball” and the dividend is the “snow” on the “slope”.


Steps:
(1) Find a basket of good companies that can pay consistent good dividend.
For example, the dividend yield of AscendasREIT(A17U), the dividend paid for the last 5 years(in cents): 15.64 , 13.60, 12.69, 13.33, 14.18

(2) Calculate the average dividend paid for the last 5 years.
The average is (15.64+13.60+12.69+13.33+14.18) / 5 = 13.89
(3) Use the following formula:
Reasonable price = average dividend x 20 /100
Cheap price = average dividend x 16 /100
Expensive price = average dividend x 32 /100
So, for AscendasREIT:
Reasonable price: 13.89 x 20 = $2.778
Cheap price: 13.89 x 16 = $2.222
Expensive price: 13.89 x 32 = $4.445
Why use the number 20, 16, 32? This is because 1/20 = 5% dividend yield, 1/16 = 6.25% dividend yield and 1/32 = 3.125% dividend yield. So, if you use dividend paid x 16, it will give you dividend yield of 6.25%.
(4) Buy the share when the price is between "cheap" and "reasonable".
(5) Re-invest the dividend received. Observer and hold.
(6) You can sell the share when the price is "expensive" for capital gain.
(5) Re-invest the dividend received. Observer and hold.
(6) You can sell the share when the price is "expensive" for capital gain.
Monday, July 15, 2013
Stock tips
Go around various blogs and ask around stock tips never fail to annoy me. For me, whoever asking this is a "gambler". They don't know what they invest on, lazy to do homework, but want to take short-cut to make money. So, will you claim from the blogger if you lose $?
Ok, let's cool down and i analysed why we shouldn't hunt for stock tips:
(1) Smart bloggers / Guru always have "disclaimer" to protect themselves so they can say whatever they like, without holding responsibilities.
(2) There is always a lot of assumptions/conditions that they may not tell you. I can say you can make money when you buy Singtel share at S$1.80. But i may not tell you, this is the time when STI is 1600.
100 people has 100 different portfolios, different capital, different strategy at different time. They may have the time to hold but you may not.
(3) Asymmetric information. There are many investment companies with many stock analyser, while OCBC researcher may think Singtel worth $3.5, CIMB may think Singtel worth $2.80. There are so many ways to "calculate" the "true value" of a company. Think about it, if those "fortune teller" is so accurate, why they still need to work so hard for the company?
So, please wake up, there is no shortcut in live, so does investment. It is rather silly to just follow what people said. You are the one responsible for your hard earn money. Nevertheless, the only person that i willing to share my tips faithfully is my wife. Just because, her money is also my money..haha..
Excel Macro VBA open current file path
Sub OpenFilePath()
'Purpose: Open the path where the current workbook is saved, using window explorer
'InputBox "Document Path", "Show DocumentPath", ActiveWorkbook.FullName
'call window explorer
'MsgBox ActiveWorkbook.Path
retval = Shell("C:\WINDOWS\explorer.exe /e ,/select," & ActiveWorkbook.FullName, vbNormalFocus)
End Sub
Excel Macro VBA remove extra space
Sub TrimColumn()
'Purpose: Remove extra empty space of data in each cell for the whole column
'Example: "abc " -> "abc"
Dim i As Double
Dim NoOfRows As Double
Dim ColumnNo As Integer
Dim DataRange As Variant
Dim myString As String
NoOfRows = ActiveSheet.UsedRange.Rows.Count
ColumnNo = ActiveCell.Column
DataRange = Range(Cells(1, ColumnNo), Cells(NoOfRows, ColumnNo))
If IsEmpty(DataRange) = True Then
Exit Sub
End If
With Application
.Calculation = xlCalculationManual
.ScreenUpdating = False
.DisplayStatusBar = False
End With
For i = 1 To NoOfRows
myString = DataRange(i, 1)
myString = Trim(myString)
DataRange(i, 1) = myString
Next
Range(Cells(1, ColumnNo), Cells(NoOfRows, ColumnNo)) = DataRange
With Application
.Calculation = xlCalculationAutomatic
.ScreenUpdating = True
.DisplayStatusBar = True
End With
End Sub
Excel Macro VBA suffix minus sign to become prefix
Sub RemoveMinus()
'Purpose: Move the minus sign suffix on a number to the front.
'Example: 235- become -235
Dim rngStep As Range
On Error Resume Next
For Each rngStep In ActiveSheet.UsedRange
If Right(rngStep.Value, 1) = "-" Then
rngStep.Value = "-" & Mid(rngStep.Value, 1, Len(rngStep.Value) - 1)
End If
Next
On Error GoTo 0
End Sub
Thursday, July 11, 2013
Investment books
Good books to share:
(A) Technical analysis技術分析(for choosing what price to buy)
抓住飆股輕鬆賺 : 看圖選股 找出最佳買賣點
作 者:朱家泓
出版項:臺北市, 2011
集叢名: 創富
ISBN:9868734606
my rating: 5/5
抓住線圖股民變股神
作者:朱家泓
出版社:原富傳媒
出版日期:2012年03月24日
ISBN:9789868734616
my rating: 5/5
(B) Fundamental anlysis (for choosing what stock to buy)
一次就懂:怪老子帶你看懂財報選好股 (basic)
Website:http://www.masterhsiao.com.tw/
作者:蕭世斌
出版社:Smart智富
出版日期:2012年10月27日
ISBN:9789867283412
my rating: 4/5
財報狗教你挖好股穩賺20% (basic)
作者:財報狗
出版社:Smart智富
出版日期:2013年04月27日
ISBN:9789867283443
my rating: 4.5/5
財務自由的講堂:財務報表是投資的偉大航道
作者:黃國華
出版社:先覺
出版日期:2012/10
ISBN : 9789861341996
my rating: 3/5
財務自由的世界:財務分析就是一場投資的戰
作者:黃國華
出版社:先覺
出版日期:2012/10
ISBN : 9789861341989
my rating: 3/5
(C) Books about economic (quite difficult but useful, for study long term trend)
Title: 經濟指標告訴你&沒告訴你的事
Website: http://www.wretch.cc/blog/izaax
作者:愛榭克
出版社:Smart智富
出版日期:2012年04月27日
ISBN:9789867283375
my rating: 4/5
Wednesday, July 10, 2013
POEMS stock trading charges
To trade SGX Market (Traded Currency in SGD) stock using Phillip Securities (POEMS). The commission charge is 0.28%(online), Minimum charge $25
Plus Clearing Fees of 0.04% (max. of $600)* & SGX Access Fee of 0.0075% on the contract value and GST on brokerage, Clearing Fees & SGX Access Fee.
Excel formula:
=(1+7%)*(MAX(C5*0.28%,25)+C5*(0.04%+0.0075%))
Assuming C5 is Purchase Price * no of Lot.
E.g.: purchase Singtel of 5000 lots @ $3 =(1+7%)*(MAX(5000*3*0.28%,25)+5000*3*(0.04%+0.0075%))
=$52.56
You can download my version of stock calculator here:
https://www.dropbox.com/s/grk0lfuwz6d9gny/StockCalculator_v3.xls
Tuesday, July 9, 2013
How to calculate annualized return
Annualized Return
Compare 2 investments tools of compound interest, or Fixed Deposit for easier understanding:
(A) 3 years return 30%
(B) 10 years return 120%
Which one is more profitable?
If you think 30%/3 = 10% and 120%/10 = 12% so, (B) is better. Then you are wrong. This is because time value of money. The return of every year is different, so, you cannot "average" it by year. You need "Annualized" them.
2 formulas can be used:
(1) (1+return%)^(1/no of years)-1
(2) (ending value / start value)^(1/no of years)-1
Back to the case above, (1+30%)^(1/3)-1=9.14%, (1+120%)^(1/10)=8.2%.
Conclusion: (A) is more profitable.
So, if anybody ask you invest 100k and can get 180k (80% return) in 20 years, you can ask he back, "are you happy with 2.98% return every year?"
You can read more here.
Best Investment tip
There are a lot of investment tools, but the highest return investment tool for age under 35 is investment on yourself. Many just want to become Warrent Buffett no 2 or take short cut become millionaire. Yes, you can find a lot of story about successful people but I bet those lost big money is more than that. No loser will publish book how they lost big money.
Take your time, learn hard, get as many certification, knowledge, skill, experience as you can. Those things will follow you forever. Nobody can assure he/she always win in investment but you will lose nothing on investment yourself.
Do you like to read the stories of how other people success and plan to copy or combine the recipe? The answer is don't just believe and follow. It is rather silly to just listen whatever people said. There are many factors that people succussed and successful people may not have time or obligation to tell you everything. You may read more here.
Which do you believe: certification and your salary or luck and your "sure win tips?"
Dividend Yield vs Share Price
As you known,

Assuming Dividend ($) is fixed. For 1% drop in Share Price ($),
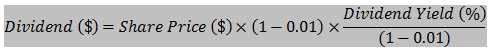


Assuming Dividend ($) is fixed. For 1% drop in Share Price ($),
So, for n% drop in Share Price, Dividend Yield (%) will increase
For example, if dividend yield is 5%, assume dividend ($) is fixed, a 1% drop in share price will increase dividend yield of 0.05%  . For a 7% drop in share price, the dividend yield will increase by 0.38%
. For a 7% drop in share price, the dividend yield will increase by 0.38%
As shown below, for a share to increase dividend yield from 5% to 6%, the share price need to fall more than 16%!
Monday, July 8, 2013
Singapore IRAS Income Tax Calculator
I created this IncomeTax Calculator for submission of my Singapore IRAS Income Tax. I find IRAS website calculator too complicated.
My version of Singapore IRAS Income Tax calculator:
https://www.dropbox.com/s/xej50h9pe4g7pno/IncomeTaxCalculator_v3.xls

My version of Singapore IRAS Income Tax calculator:
https://www.dropbox.com/s/xej50h9pe4g7pno/IncomeTaxCalculator_v3.xls
Present Value / Present Value Annuity
Present Value("PV") is the opposite of Future Value. Take previous example, in order to have $216,623 at 10 years later and you willing to invest $11,000 yearly in an investment that give 6% return, how much capital you need? (Excel formula: PV(6%,10,11000,-216623,0)=$40,000)

You can also use Present Value to estimate inflation. In short, inflation means how fast you money shrinking. Example inflation of 3%: your $100 now will become $100 x (100%-3%) = $97 next year. $97 x (100%-3%) = $94. From the graph below: $100 will become $72, $64, $57 for 3%, 4% and 5% inflation respectively.

Test: If you think you can retire with S$1,000 (money now), how much money you need in 20 years later due to 3% inflation?
Answer: Use formula "FV": FV(3%,10,,-1000,0) = $1,344
For $2000(money now) and 3% inflation: FV(3%,10,,-2000,0) = $2,688
For $1000(money now) and 4% inflation: FV(4%,10,,-1000,0) = $1,480
You can download Present Value Excel from:
https://www.dropbox.com/s/dwst6cnyox75530/PresentValue.xlsx
Future Value / Future Value Annuity
If you just want to see the result of X years later, you don't need to use previous "Investment.xls". You can use Excel "FV" formula. That should give you the same result of "Sub Total" in "Investment.xls".
Here, let me explain a few terms:

Here, let me explain a few terms:
- Compound Interest: heard of loan shark / Ah Long? 利滚利? Yes, that mean the interest is calculated based on (previous interest + capital).
- Future value : Capital money you have now, let it rolled by compound interest, X years later, the number you can get is future value.
- Future value annuity: Capital money you have now + you invest certain $ every year. Let it rolled by compound interest, X years later, the number you can get is future value annuities.
You may download the Excel :
Sunday, July 7, 2013
Investment Plan
Do you have a investment plan? Do you know how much $ you can get if you have capital of $30k and invest $10k monthly, in X number of years?
I have.
I created an Excel to track the "big plan". If i can follow my plan, i can get $1million in 29 years time??


I have.
I created an Excel to track the "big plan". If i can follow my plan, i can get $1million in 29 years time??
My plan is not how to get $1million. I want to get financial freedom! I want my investment return can sustain my expense.
I am a simple person. I think $2k (money now) per month is sufficient for me. So, I can achieve my dream 17-18 years later??!! Of cos there are lots of uncertainty: inflation, economy crisis, strike ToTo, mars attacks, end of the world blah blah blah...But i rather believe in Planning and adjust according.
Will I success? Time will tell....but I won't! who will tell "hey, i'm rich, come rob me..".haha....just be quiet...."Diam Diam Ubi"...
You may download the Excel and play around with it. Feedback are welcomed.
Subscribe to:
Posts (Atom)